In this project, I analyzed breathing signals from a non-contact vitals system monitor to extract breathing rates.
Repository with code can be found here.
Background
The following project was a candidate assessment where I was given several data-sets consisting of breathing signals
and was asked to generate an algorithm to determine the overall respiration rate.
Due to IP concerns, I cannot openly share the data. However, I would like to present the methodology as well as my code
for generating a solution.
The data provided was infant breathing signals from a non-contact vitals monitoring system using Doppler-based radio-frequency waves.
Several papers have suggested a similar kind of system, which I will leave linked here
[Hall et. al,
Matthews et. al].
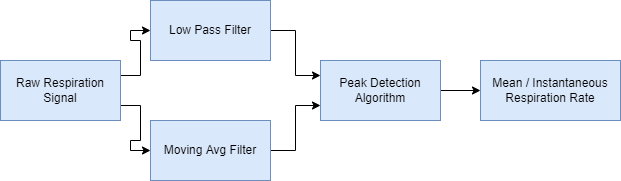
Methodology
Above is a block diagram form of the proposed solution. Specific sections below detail the thought process and analysis of the waveform at each step.
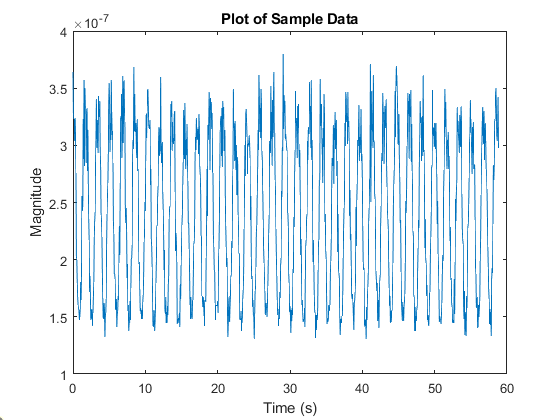
Data Visualization
Using the provided sampling frequency of the signal, the time scale of the signal was reconstructed and one minute of data was extracted and plotted.
It is clear this signal requires some amount of processing to reduce noise and smooth the identified breathing peaks. As such, the FFT of the signal
was computed and plotted in the next step.
Pre-processing - Strategy
I decided to use two different methods to smooth the data, one frequency-domain analysis method and one time-domain analysis method. Both methods are detailed below.
Frequency Domain Analysis
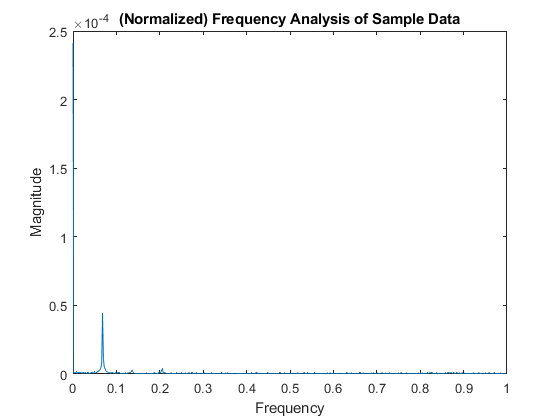
The one-sided DFT of the signal was computed and plotted as shown on the left. The frequency axis was normalized
as MATLAB uses normalized frequency as parameters for its filter functions.
Analysis of this spectral plot does require some domain knowledge to understand what we're looking at. It is known that the frequency range of respiratory
signals is relatively low at approximately 0.1-0.5 hz (around 10-30 breaths/min).
However, infantile breathing rate can vary much more wildly, with breathing rates of 0.3-1 hz (20-60 breaths/min).
Based on the graph on the left, it looks this is the dominant frequency on the signal (sampling frequency is about 17hz, so 0.1 normalized is around 1hz).
Thus, I designed a bandpass filter with a passband of 0.01-0.1hz (normalized) to reduce noise.
I used a 5th order Butterworth filter with the above specifications to reduce noise. The Butterworth filter is the most ideal filter
to use in this case as it has a relatively low amount of attenuation in the passband as opposed to other traditional linear filters (more on that
here).
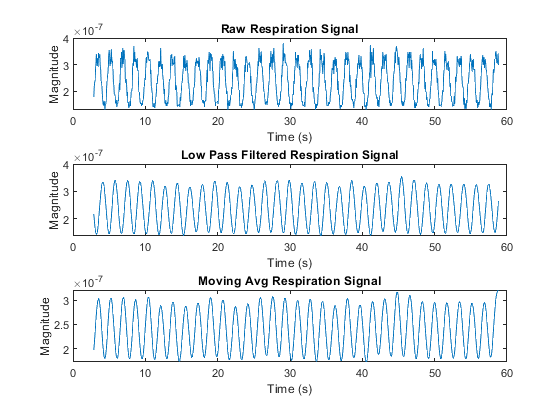
Time Domain Analysis
For the time domain analysis, I used a moving average filter with a 10-point centered moving window.
The result of both filtering methods is presented on the right with reasonable levels of agreement. The low-pass filtered data is obviously lagged slightly in time
due to filter phase shifts.
Algorithm Development - Mean Respiration Rate
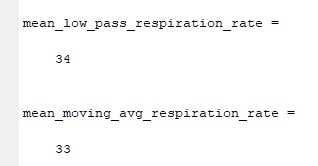
I used a simple peak detection algorithm to calculate the mean respiratory rate over the length of the sampled signal. The algorithm iterates over the input signal
point by point and compares the previous sample and the next sample to the current sample; if they are both less than the current sample, a peak, or breath, is recorded.
It is important to note that the algorithm is not intended to be production-ready or particularly robust, but simply a starting point towards refinement of a more advanced algorithm
following several trial-validation cycles.
The figure to the left shows the output of both algorithms on a test data-set. While no ground-truth was provided, it seems that both algorithms are in agreement with respect
to the reported respiration rate that seems to be consistent with normal infant breathin rates. The low-pass filter registered an extra breath at the beginning of the data-set,
which can be accounted for by throwing away the first set of sample data due to filter delay.
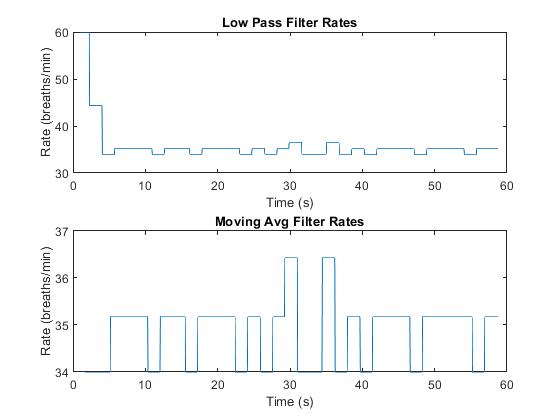
Algorithm Development - Instantaneous Respiration Rate
The instantaneous respiration rate was calculated by determining the time between detected breaths when traversing through the input signal. 60 divided by this time period
then gives the instantaneous respiration rate. A graph of the calculated instantaneous rates is shown to the right. Again, the graphs are fairly agreeable, ignoring the
start-up delay in the low-pass filter graph.
A point of contention during the design of this algorithm was whether or not to keep the calculated instantaneous rate discrete, or to create a continuous time signal
by interpolating between data points and filling in the gaps. Ultimately, it was decided to keep it discrete as the goal of the algorithm was to provide a number that would
be presented on a UI that is sampled at a fixed rate, presumably at a rate similar to the respiration rate.
Discussion and Considerations
Obviously, this algorithm is not the most robust and several improvements/considerations can be made with respect to usage in the product as well as accuracy while testing.
Several improvements and considerations that come to mind are, for example:
1. Using the mean of the signal as a threshold baseline to detect a peak, rather comparing data neighbors. This would help improve algorithm efficiency/spatial complexity, but may
cause issues when the detected signal is extremely noisy or weak.
2. Taking the first derivative of the filtered signal and detecting zero crossings, which may also help improve algorithm efficiency by sorting the data and only selecting timestamps
where the value is zero.
3. As discussed previously, interpolating between calculated instantaneous respiratory rates to produce a more continuous signal if this graph is something that is provided
to customers and is seen as more beneficial.