In this project, I used detrended fluctuation analysis, a non-linear signal processing technique,
to analyze self-similarity of the gait stride to quantitatively assess neuromuscular degeneration with age and disease.
Background
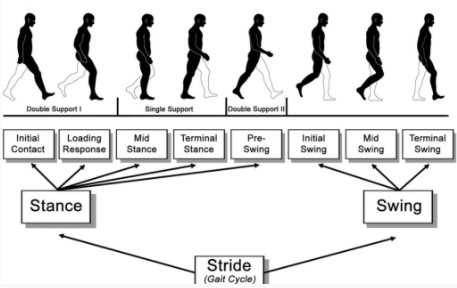
The gait cycle, defined as the time-frame between when one foot hits the ground and that same foot hits the ground again
during normal locomotion, is an important physiological measure for physicians that is often used to evaluate the progression
of musculoskeletal disorders. In the figure on the right, take note of the leg in black: when it hits the ground on the next step,
a gait cycle (also known as stride interval) has been completed.
It is well known that the duration of the gait cycle exhibits fractal
behavior. When a system is fractal in nature, this means that its dynamics
exhibit an infinitely complex pattern that repeats over and over again,
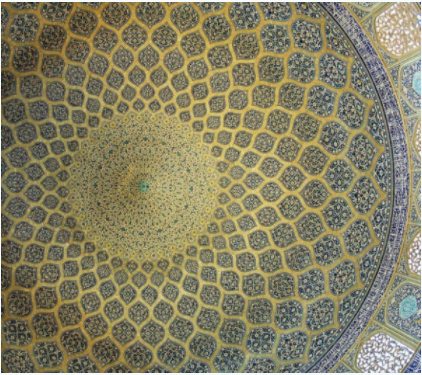
or is self-similar across all scales. For sure you have seen this in an
architectural setting, as shown on the left. These types of patterns are
known as fractal, since they are created using never-ending patterns that
are self-similar. The gait cycle, as with many other systems in nature,
exhibits this same behavior.
The neural mechanism behind this fractal behavior is currently unknown.
However, recent studies have reported a decrease in self-similarity of the
gait cycle with age and disease progression, specifically with Parkinson’s
disease and Huntington’s disease. Thus, evaluating self-similarity in the
gait cycle in healthy patients, older patients, and diseased patients is
helpful in understanding why this decrease occurs. Knowing where the
degeneration comes from can help us intervene over the course of this d
egeneration faster.
Detrended fluctuation analysis (DFA) is a non-linear signal processing
technique that mathematically quantifies how self-similar a signal is.
The detailed method behind this quantification can be found on
Physionet.
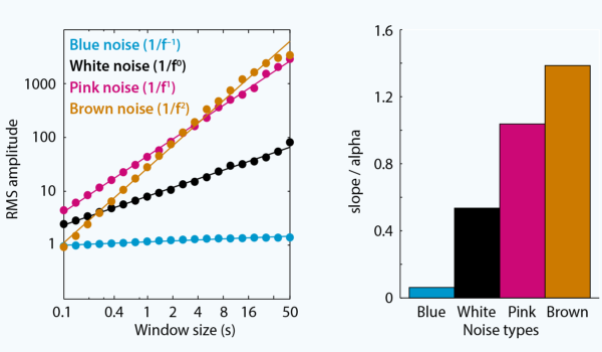
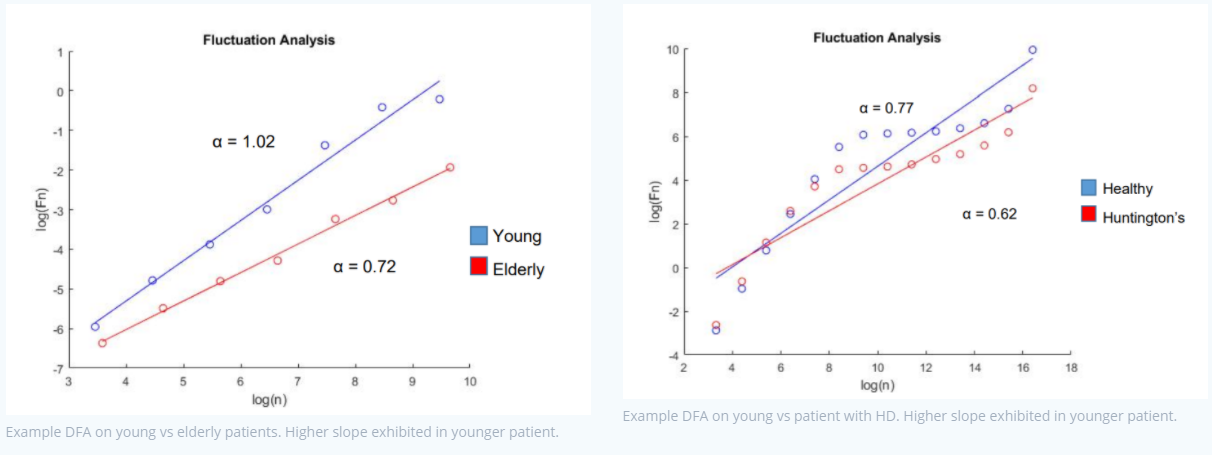
The result of DFA is a straight line plotted on a log-log plot, of which
we are concerned with the slope. The value of the slope of this line tells
us a great deal about how self-similar the signal is: a value of 1.0
indicates 1/f fractal noise and a value of 0.5 indicates an uncorrelated
signal.
Methods and Results
Available data from PhysioNet was used to evaluate the decrease in
self-similarity in young, healthy patients, vs. old and diseased patients. MATLAB was used for signal
analysis and processing.
Findings
The main finding of this analysis is that gait cycle self-similarity is
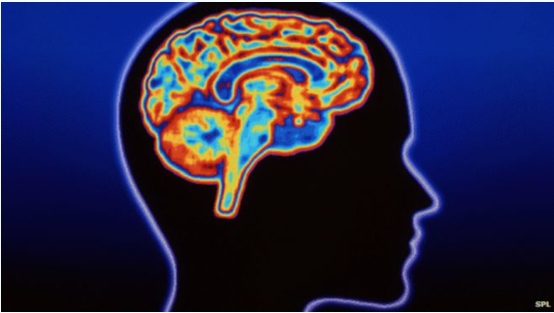
decreased in elderly and Huntington’s (HD) patients relative to young, healthy
patients. HD is characterized by atrophy of the basal ganglia. Thus,
it is likely that the basal ganglia is highly involved in the regulation of fractal
behavior exhibited in healthy patients. Further research is needed to validate and
elaborate on these findings.
While this type of analysis has not yet elucidated the neural mechanisms behind the
deterioration of self-similarity in the gait cycle with age and disease, it can prove a
useful quantitative measure for the progression of these degenerative mechanisms.